Case study
From manual exports to automatic ERP reporting
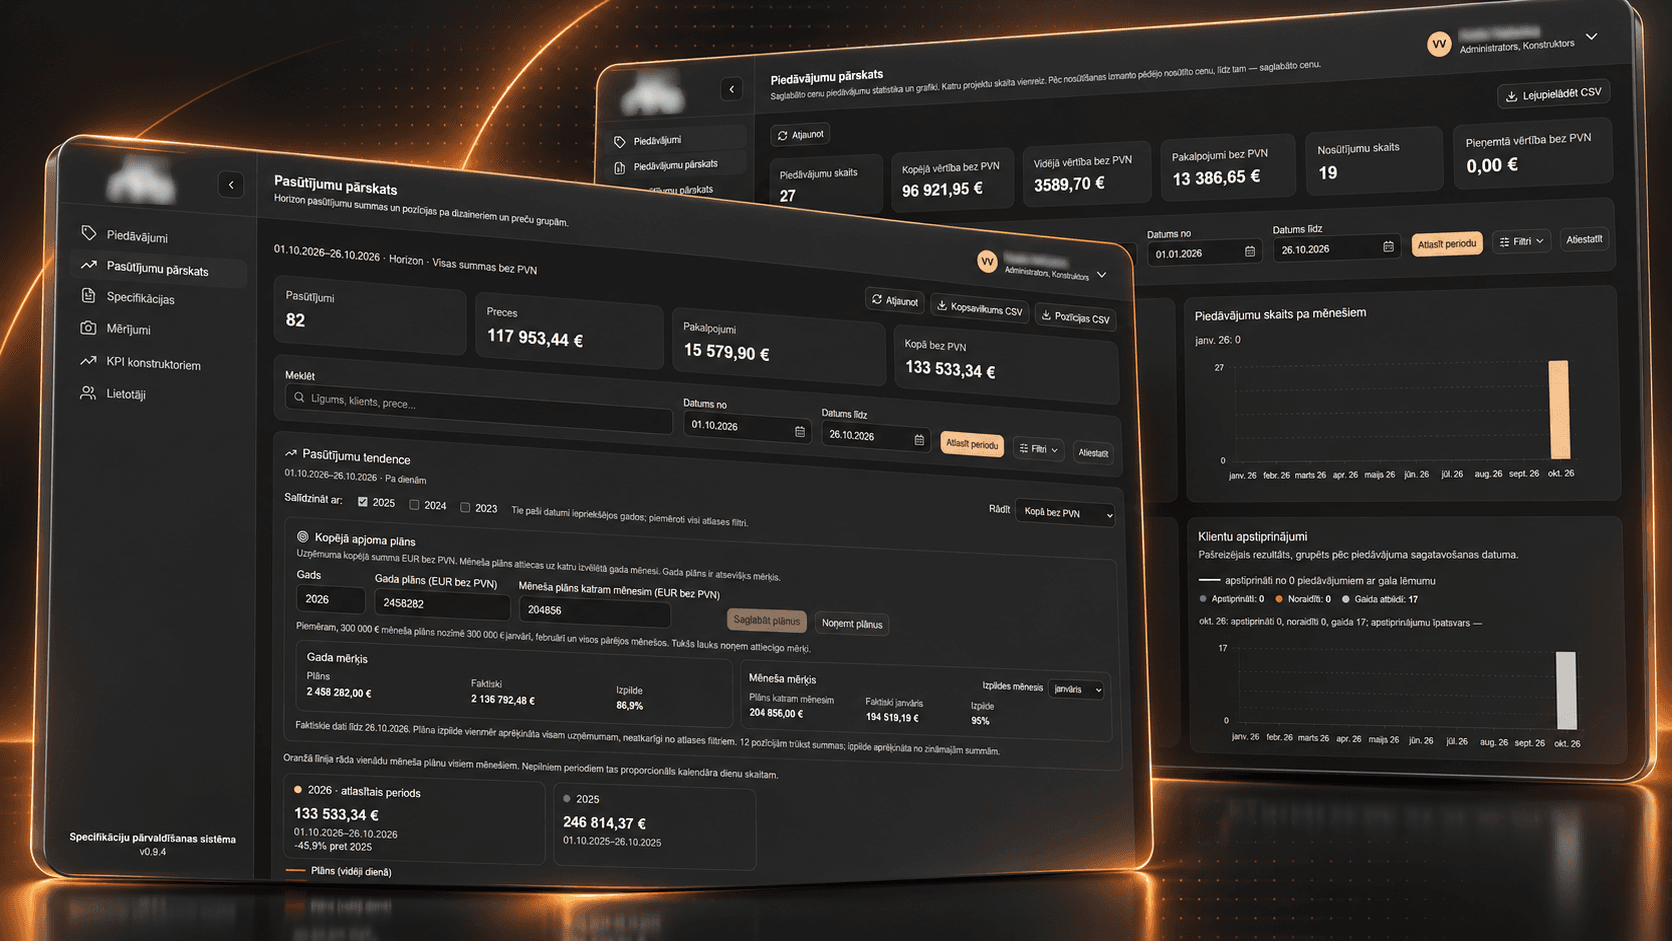
I built a Next.js dashboard connected to Horizon ERP data in Microsoft SQL Server. It gives management a current view of quotations, orders and KPIs, replacing repeated CSV exports and spreadsheet preparation.
Development, testing and adjustments took place over three days, working in sessions rather than full-time.
The dashboard extends an internal production system already used by designers and design engineers, making operational reporting available within the same environment.
The challenge
Finding the right data in an unfamiliar ERP database
With no ready-made API or dataset, I investigated Horizon's Microsoft SQL Server tables, mapped their relationships and wrote queries for quotations, orders and KPIs.
Data investigation and retrieval spanned two of the three development days. The integration had to work alongside the existing ERP system without disrupting employees' daily work.
Problem
- CSV exports from several systems needed manual preparation.
- Data was sorted and combined in Excel for a Power BI report.
- Reports lagged behind source data that refreshed hourly or more often.
- The same preparation had to be repeated each reporting cycle.
Useful reporting starts with understanding the company's data and turning it into information people can act on.
Solution
Automatic reporting from existing company data
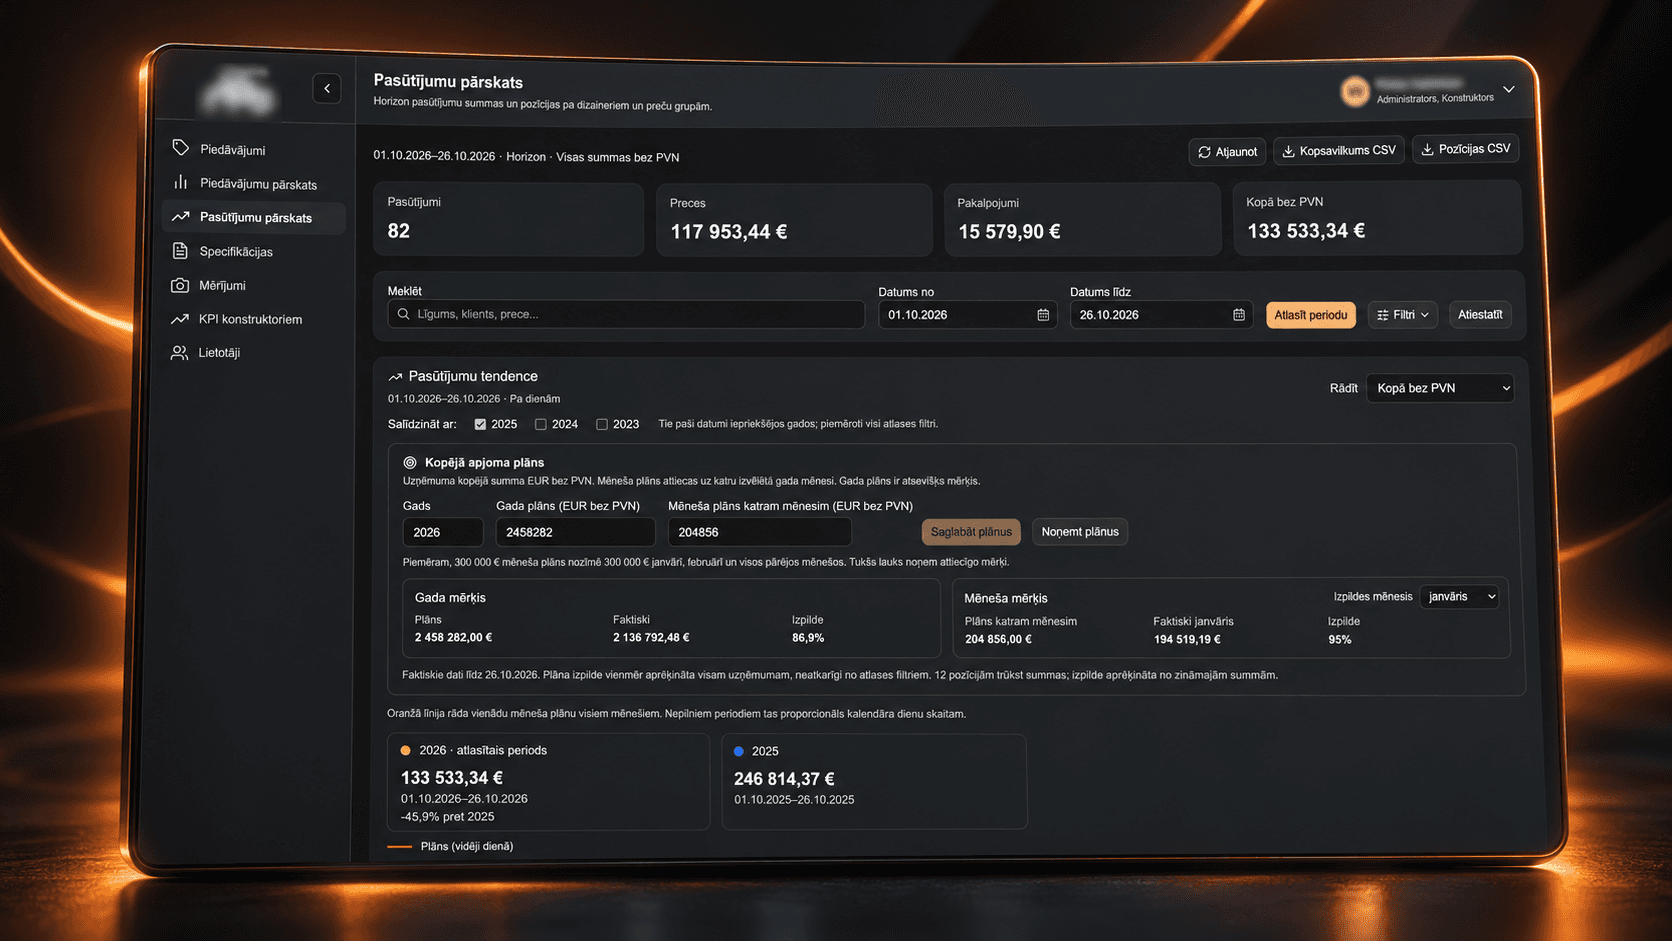
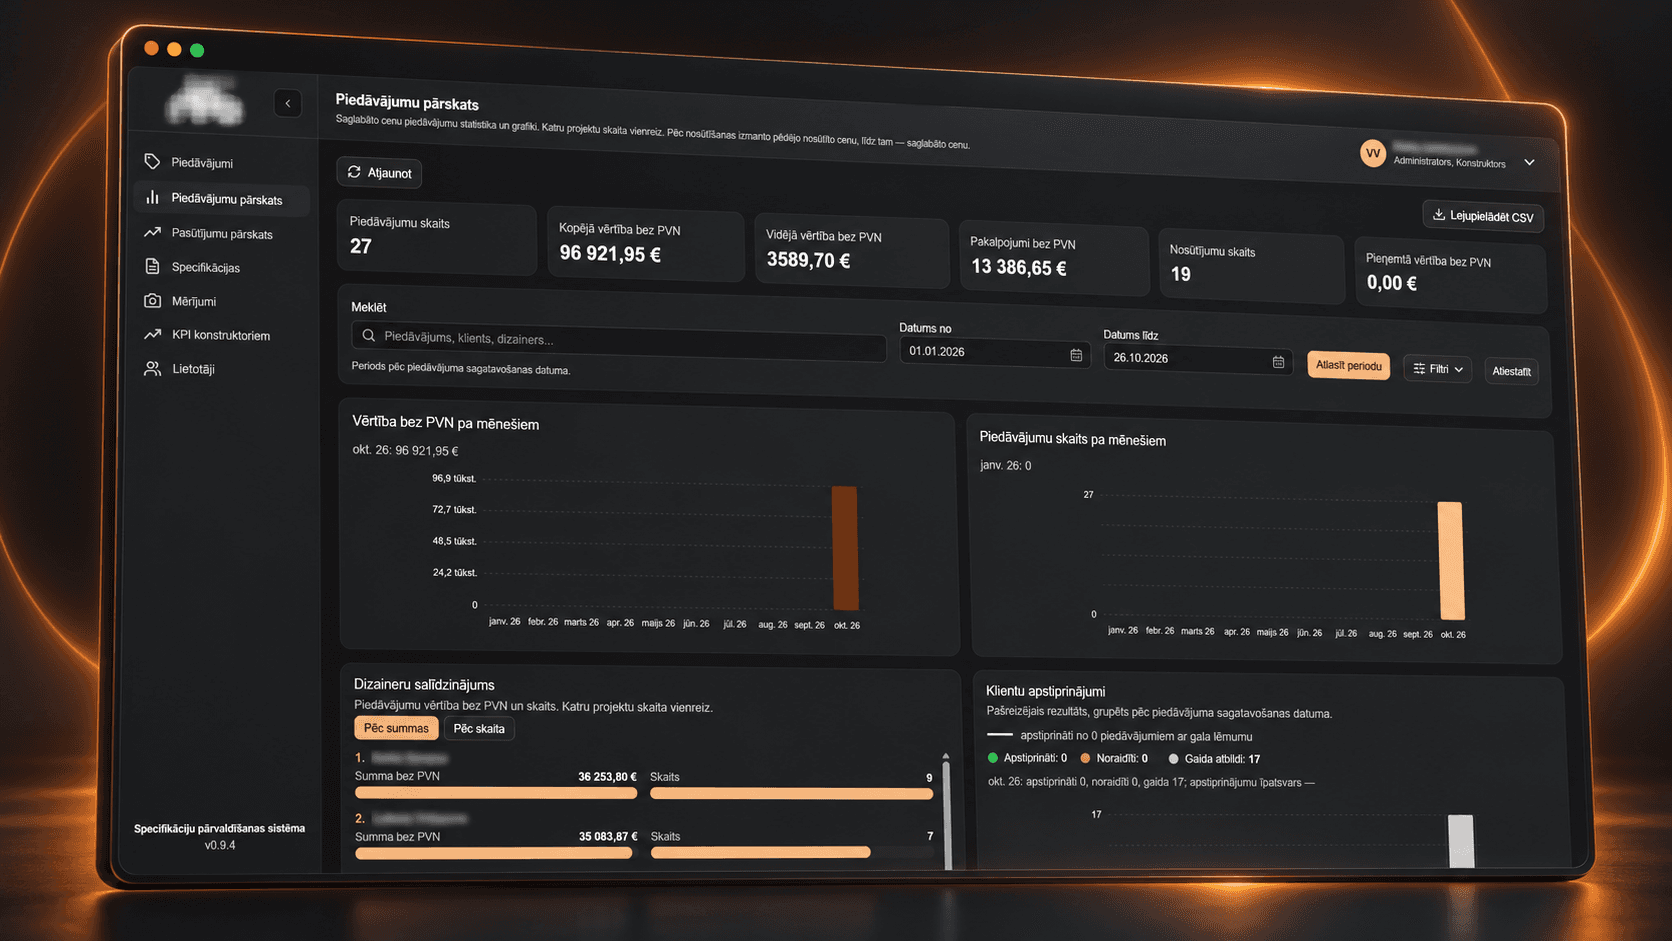
SQL queries retrieve and aggregate the required Horizon data. The application processes it automatically and presents quotations, orders and business KPIs with filtering, period comparison and CSV export.
The dashboard adds an analytical layer to the existing ERP data. Users can review current figures without rebuilding the spreadsheet workflow each time they need an update.
Results
Manual report preparation automated
Automated retrieval and processing eliminate an estimated hour-plus of manual preparation per reporting cycle. Users can review current operational figures without rebuilding spreadsheet snapshots.
The consolidated information also makes designers' pay calculations easier for management.
This dashboard extends the Specifications Management System.
My role & implementation
From database investigation to a working dashboard
As the sole developer, I designed the architecture, investigated the Horizon data model, and handled SQL queries, integration and frontend implementation.
AI tools accelerated implementation. I remained responsible for architecture, data modelling, integration decisions, validation and the final solution.
Built with Next.js, the dashboard extends the internal system on the company's local server, with access through the company VPN.
Project scope
The project covered the reporting workflow from database investigation to the interface: SQL queries, Microsoft SQL Server integration, data transformation and KPI logic, followed by filtering, period comparisons and CSV export. Frontend implementation, testing and adjustments were included in the delivery window.